From Compliance to Confidence: Mastering Continued Process Verification (CPV)

by |
by |

In the complex landscape of sterile manufacturing, initial process validation is only the first step in a lifecycle challenge: How do we maintain control over precise, high-stakes processes for years or even decades?
For injectable drugs, where every detail can potentially impact safety, efficacy, and quality, verified process performance is not a milestone: It’s an ongoing commitment that takes proactive planning, continual oversight, and a Quality by Design (QbD) strategy. Here’s a closer look at how we approach this at Vetter.

CPV begins with meticulously defining the quality goals, attributes, and parameters required to embed quality in a product’s manufacturing process. Together, these properties help support an aseptic filling approach that is both robust and predictable.
The first step, of course, is to lay the foundation of any QbD framework: the Quality Target Product Profile (QTPP). This comprehensive resource outlines the requirements for the new drug or combination product, including the dosage form, the required dose, physical properties, specific requirements for the closure system, stability characteristics, and many other key dimensions of the product.
From the QTPP, we derive the Critical Quality Attributes (CQA). These attributes—which include confirming the product’s identity, potency, sterility, and stability—are the physical, chemical, or (micro)biological properties that must be strictly controlled to achieve and maintain the desired final product quality.
To create a process that delivers our CQAs, we must then define Critical Process Parameters (CPP): Specified acceptable ranges for all steps that may impact the quality targets of the final product. Here, our goal is to develop a robust process where small fluctuations in raw materials or manufacturing conditions still afford the desired results.
This process development workflow culminates in Process Performance Qualification (PPQ), which confirms the system works under real, defined conditions before being transferred to commercial manufacturing. Maintaining the integrity of those validated processes then demands constant, data-enabled vigilance — to support both product quality and continual, consistent compliance.
In key markets such as the US and EU, regulatory authorities typically require this three-step process validation, culminating in CPV as last step(also known as Ongoing Process Verification (OPV) in EU GMP Annex 15). To comply with regulatory expectations — and continually maintain product quality — this final, ongoing phase requires a sustained program for continuous data collection and analysis.
From a regulatory standpoint, the intent is clear: This statistical program provides the necessary continual assurance that the process remains in a validated "state of control," proactively detecting negative variability before any deviations can occur. To meet this mandate for sustained control, four elements are crucial:
The result is a system that leverages those four elements to create predictive capability, sustaining the highest possible quality levels by actively maintaining control throughout the commercial lifecycle. For regulators, satisfying this expectation is a key step in maintaining a product’s compliant presence in its market.
At Vetter, the CPV process is a fully integrated component of the commercial manufacturing lifecycle for every sterile injectable we process. For each of those products, we create a tailored CPV monitoring plan in partnership with our clients, defining which output process parameters to monitor, the evaluation frequency, and the statistical methods needed.
Our approach often utilizes control charts for trend analysis. These charts help us detect process drift through statistical signals, such as outliers, sustained shifts from the historical mean, or upward/downward trends.
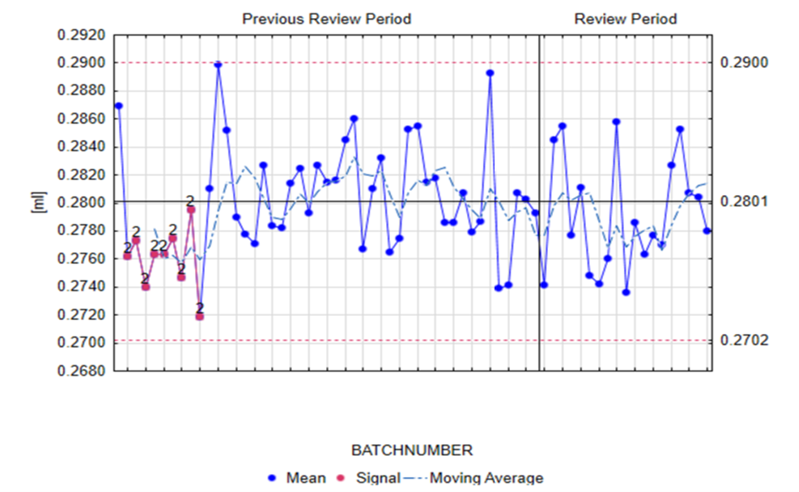
These charts are used for both statistical evaluation and trend detection, using the so-called “Nelson rules.” Three of the most common examples used to evaluate and interpret these trends include:
When anomalies are detected using these rules, our system immediately leverages deep institutional knowledge to address any potential excursion or deviation. Our quality assurance team, who lead the CPV program, coordinates a detailed evaluation involving multiple specialized departments.
This cross-functional collaboration, supported by an extensive and traceable database, is crucial for interpreting process behavior like the example above. Detailed statistical analysis tells us what is happening, but our process knowledge allows us to determine why — an essential combination for initiating any necessary Corrective and Preventive Actions (CAPAs) or Change Controls.

Of course, a CPV monitoring plan is always a living resource subject to regular review, allowing us to adjust to evolving process capabilities and product lifecycle evolution.
For example, if a CPP demonstrates a consistently high process capability index, we may risk-assess a change in monitoring frequency. On the other hand, unforeseen events may necessitate the inclusion of additional parameters for closer observation.
In both cases, the value of this commitment goes beyond regulatory compliance: We use it to actively enable the continuous process improvement essential to our cGMP operational standards.
Here, CPV provides objective, risk-based data that confirms the long-term effectiveness of any measures taken to support process performance. It confirms that our quality system is dynamic and responsive, and that CAPAs achieve the desired results. In addition, the detailed evaluation and conclusions drawn from CPV reports provide robust, supporting evidence for documents like Annual Product Reviews (APRs) submitted to health and regulatory authorities.
If you’re planning the lifecycle of a sterile injectable product, our team is ready to put this proven CPV program methodology to work for you and your therapy.